Create Your First Project
Start adding your projects to your portfolio. Click on "Manage Projects" to get started
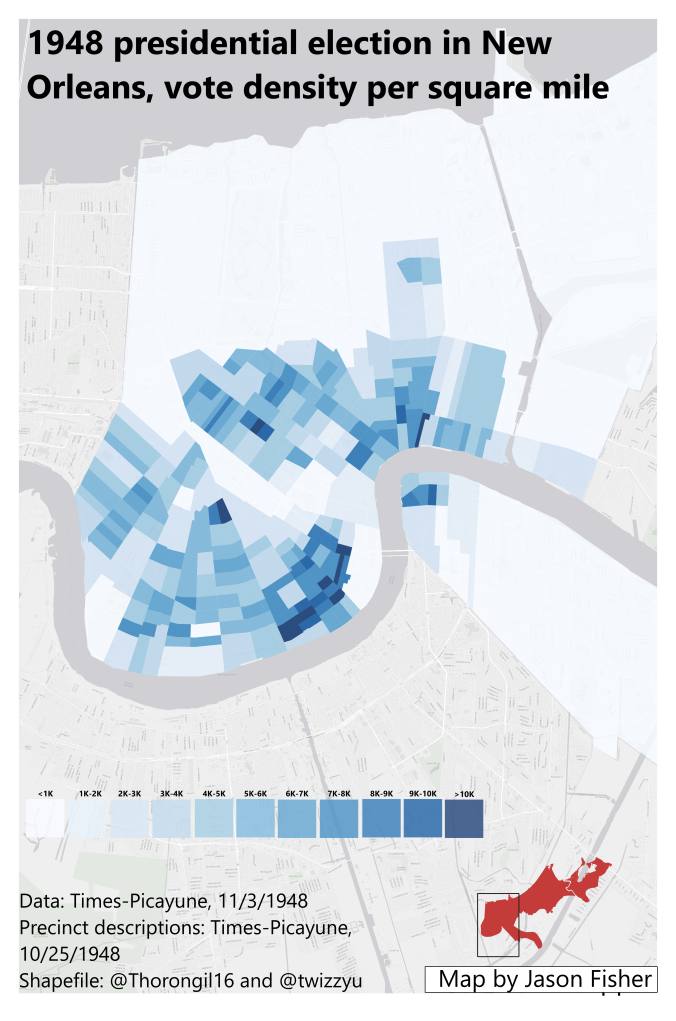
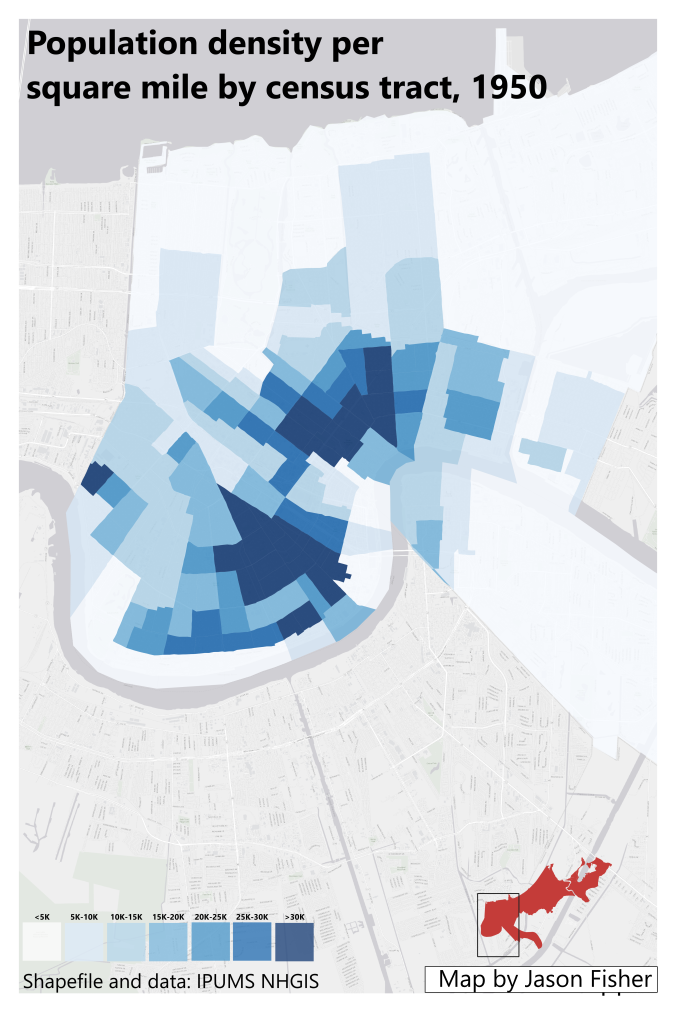
Spatial analysis of voter suppression in New Orleans, 1948
Project type
Map
Date
2024
This map shows the vote density in New Orleans in each precinct in the presidential election 1948. By comparing with a map of the population density by census tract you can see that large parts of the city are densely populated but do not have similarly dense concentrations of votes. The reason for this anomaly can be found by adding a third map: the percent of each tract's population that is African-American. Most of the areas of the city that cast few votes relative to their population are predominantly African-American. This reflects the systemic disenfranchisement of Black Americans in the Southern United States prior to the Civil Rights Movement of the 1960s.